rmoff's random ramblings
Interesting Links
Categories
Search
⌘K
RSS
Home
Categories
Interesting Links
Search
RSS
linkedin
twitter
bluesky
youtube
talks
github
Elastic
2 articles
×
2016
24 Apr 2016
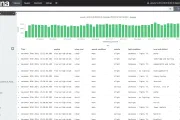
Using R to Denormalise Data for Analysis in Kibana
R
12 Apr 2016
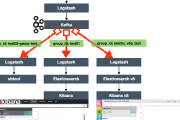
Decoupling the Data Pipeline with Kafka - A (Very) Simple Real Life Example
apache kafka
 R
R
 apache kafka
R
apache kafka
apache kafka
R
apache kafka