
OK, maybe that’s not entirely true. But my read-only client, certainly.
I was perusing the Logstash input plugins recently when I noticed that there was one for IRC. Being a fan of IRC and a regular on the #obihackers channel, I thought this could be fun and yet another great example of how easy the Elastic stack is to work with.
Installation is a piece of cake:
wget https://download.elasticsearch.org/elasticsearch/release/org/elasticsearch/distribution/zip/elasticsearch/2.2.1/elasticsearch-2.2.1.zip
wget https://download.elastic.co/logstash/logstash/logstash-2.2.2.zip
wget https://download.elastic.co/kibana/kibana/kibana-4.4.2-linux-x64.tar.gz
unzip \*.zip
tar -xf kibana-4.4.2-linux-x64.tar.gz
sudo mv elasticsearch-2.2.1 logstash-2.2.2 kibana-4.4.2-linux-x64 /opt
(you’ll also need Oracle JDK installed if not already, here’s a handy way to get it from the CLI).
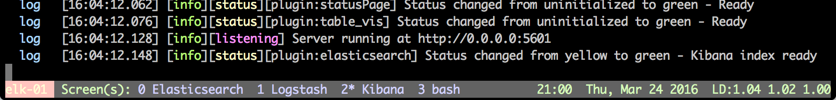
Start up Elasticsearch and Kibana:
/opt/elasticsearch-2.2.1/bin/elasticsearch
/opt/kibana-4.4.2-linux-x64/bin/kibana
Use screen, cos it’s awesome, to run these in parallel on the same SSH connection.
Now create a file (e.g. logtash-irc.conf) to hold the Logstash configuration. It’s very simple - connect to the IRC server, on a given channel, then add geographical attributes to each message based on the host of the user, and then dump the whole lot to both stdout and Elasticsearch:
# @rmoff / March 24, 2016
input {
    irc {
        channels => "#obihackers"
        host => "chat.freenode.net"
    }
}

filter {
    geoip {
        source => "host"
    }
}

output {
    stdout {
        codec => "rubydebug"
    }
    elasticsearch {
        hosts => "localhost"
        index => "logstash-irc-%{+YYYY.MM.dd}"
    }
}
Now set Logstash running:
/opt/logstash-2.2.2/bin/logstash -f logstash-irc.conf
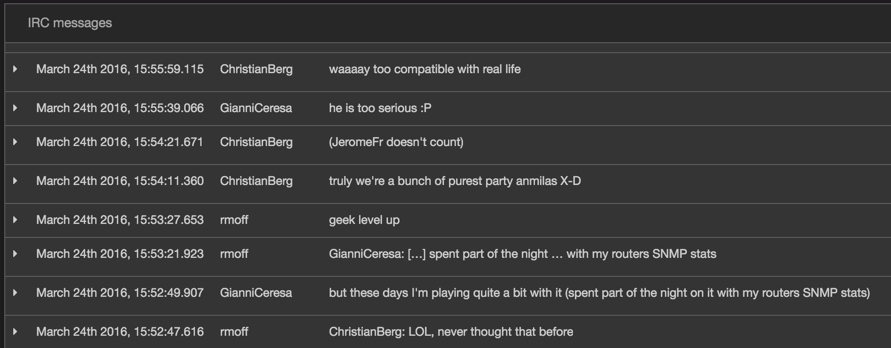
Now any message to the channel will get picked up by the bot, sent to Elasticsearch, and echoed to stdout:
{
       "message" => "ChristianBerg: LOL, never thought that before",
      "@version" => "1",
    "@timestamp" => "2016-03-24T15:52:47.616Z",
          "user" => "rmoff!~rmoff@12345",
       "command" => "PRIVMSG",
       "channel" => "#obihackers",
          "nick" => "rmoff",
        "server" => "chat.freenode.net:6667",
          "host" => "host-12345",
         "geoip" => {
                      "ip" => "1.2.3.4",
           "country_code2" => "GB",
           "country_code3" => "GBR",
            "country_name" => "United Kingdom",
          "continent_code" => "EU",
             "region_name" => "B4",
               "city_name" => "Shipley",
                "latitude" => 53.83330000000001,
               "longitude" => -1.766699999999986,
                "timezone" => "Europe/London",
        "real_region_name" => "Bradford",
                "location" => [
            [0] -1.766699999999986,
            [1] 53.83330000000001
        ]
    }
}
You can quickly check that the data’s making it into Elasticsearch by running:
curl -XGET 'http://localhost:9200/logstash-irc-*/_search?pretty'
You should get something like this back:
{
  "took" : 6,
  "timed_out" : false,
  "_shards" : {
    "total" : 5,
    "successful" : 5,
    "failed" : 0
  },
  "hits" : {
    "total" : 278,
    "max_score" : 1.0,
    "hits" : [ {
      "_index" : "logstash-irc-2016.03.24",
      "_type" : "logs",
      "_id" : "AVOpXg1lfUfBfaUyS5CU",
      "_score" : 1.0,
      "_source" : {
        "message" : "rmoff: I can't even get an IP from hugh_jass",
        "@version" : "1",
        "@timestamp" : "2016-03-24T11:58:57.401Z",
[...]
Now the data’s in Elasticsearch, it’s a piece of cake to knock up a quick dashboard in Kibana with auto-refresh switched on, showing the current channel activity and some key stats for the day:
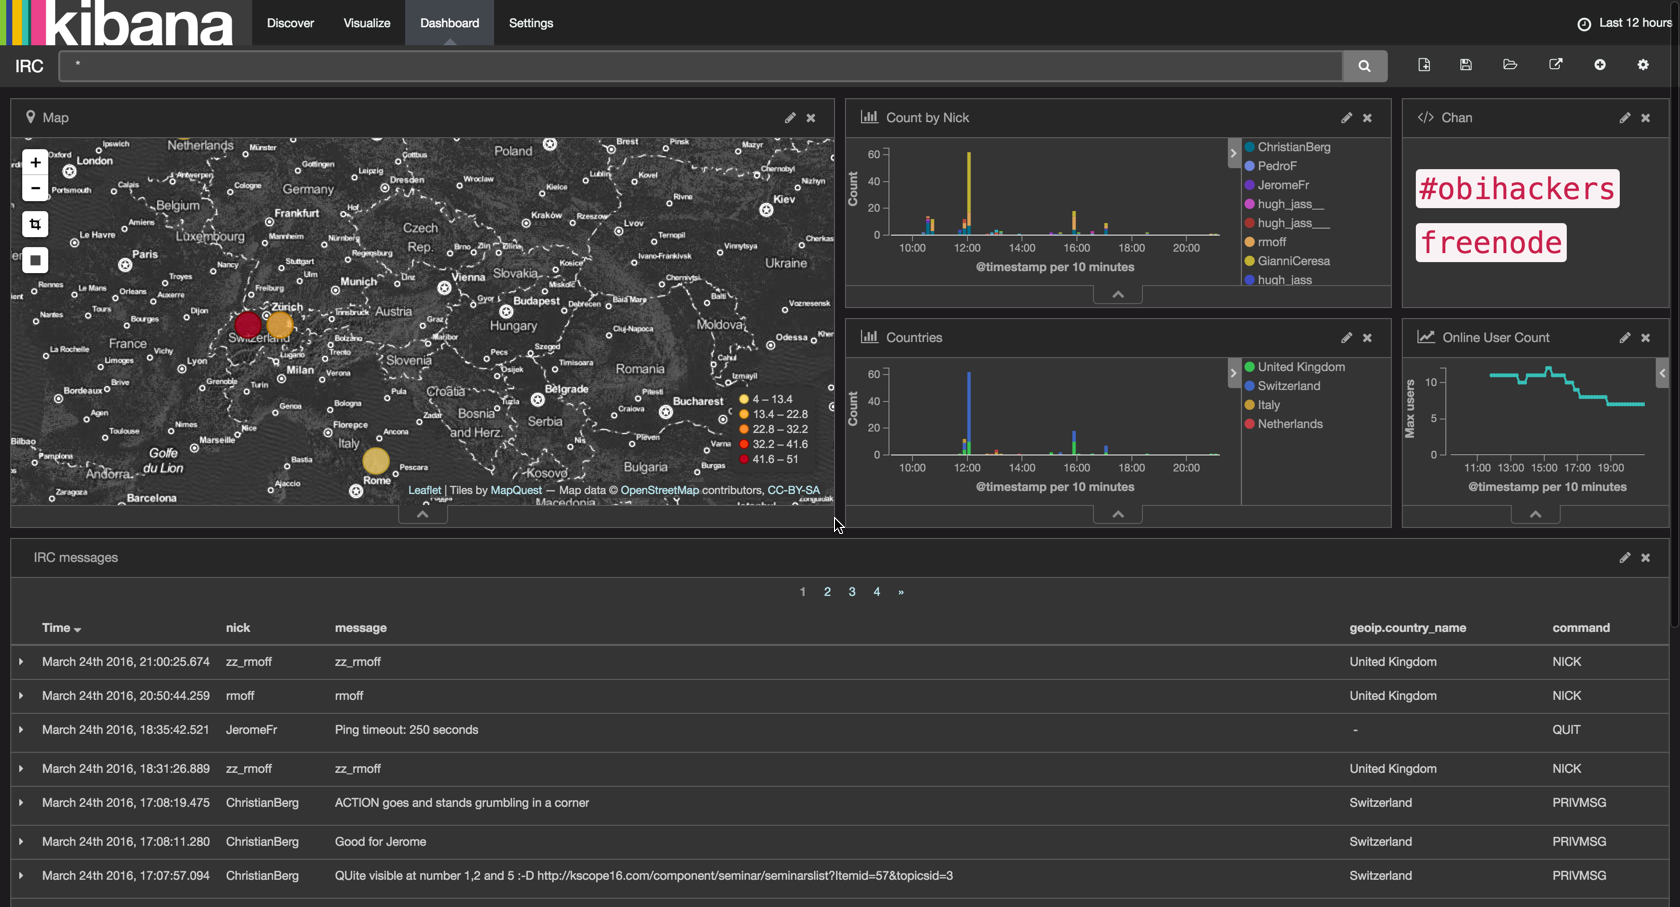
If you’ve not built a Kibana dashboard before, check out other articles I’ve written which walk through the process.