Reddit is one of the longer-standing platforms on the internet, bringing together folk to discuss, rant, grumble, and troll others on all sorts of topics, from Kafka to data engineering to nerding out over really bright torches to grumbling about the state of the country—and a whole lot more.
As a social network it’s a prime candidate for using graph analysis to examine how people interact—and in today’s post, hunt down some sneaky shills ;-)
I’ve loaded data for several subs into Neo4j, a graph database. Whilst RDBMS is great for digging into specific users or posts, aggregate queries, and so on, graph excels at complex pattern matching and recursive relationships.
It’s a case of best tool for the job; you can do recursive SQL instead of graph, it’s just a lot more complicated. Plus the graphical tools I’ll show below are designed to be used with Neo4j or other property graph databases.
The Data 🔗
In Neo4j the nodes (or vertices) are user, subreddit, comment, and post. The edges (or relationships) are how these interact.
For example:
-
a user [node] authored [edge] a post [node]
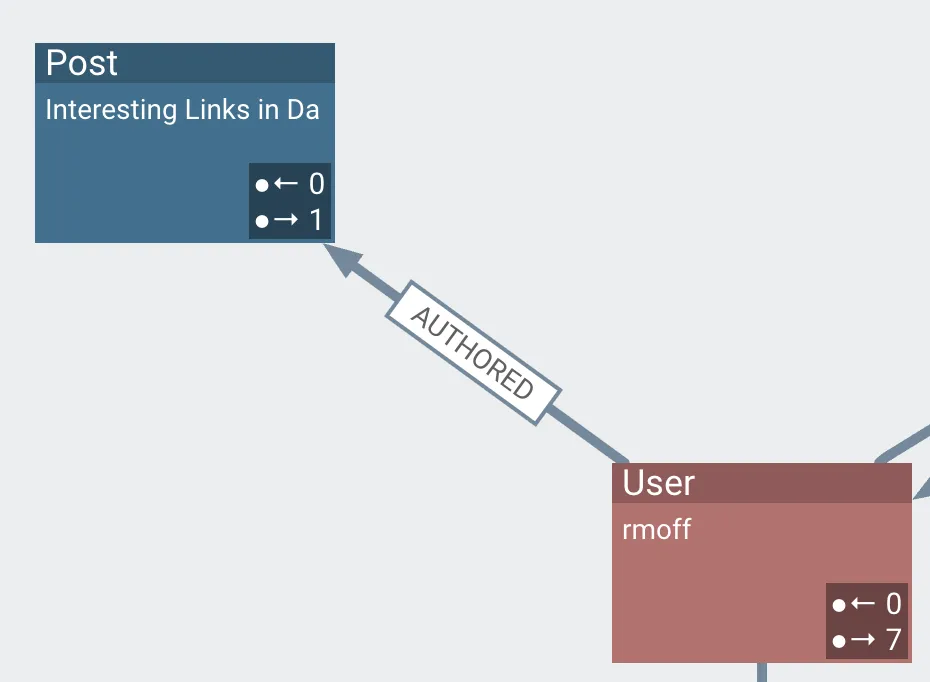
-
a user [node] posted in [edge] a subreddit [node]
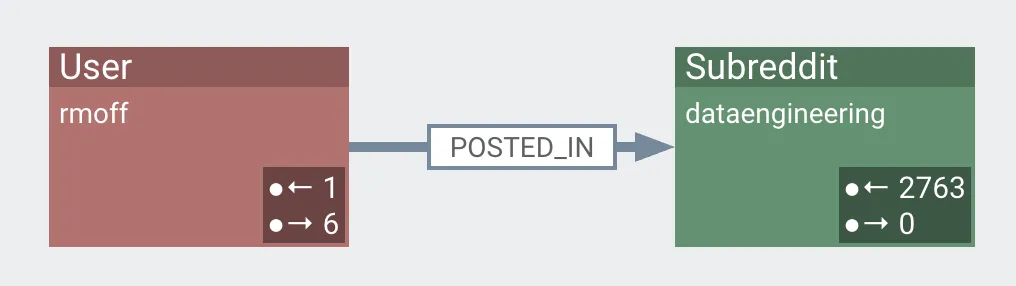
These relationships can be analysed independently, or combined:
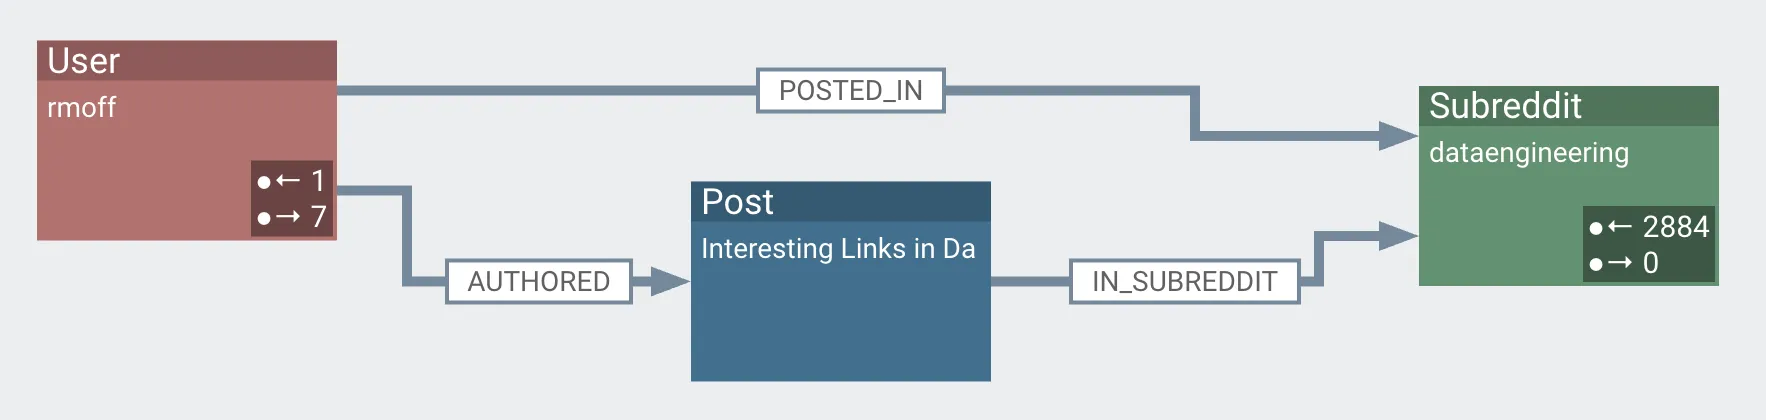
| You’ll see here another relationship that’s exposed: A post [node] in subreddit [edge] subreddit [node] |
Poking around the Graph 🔗
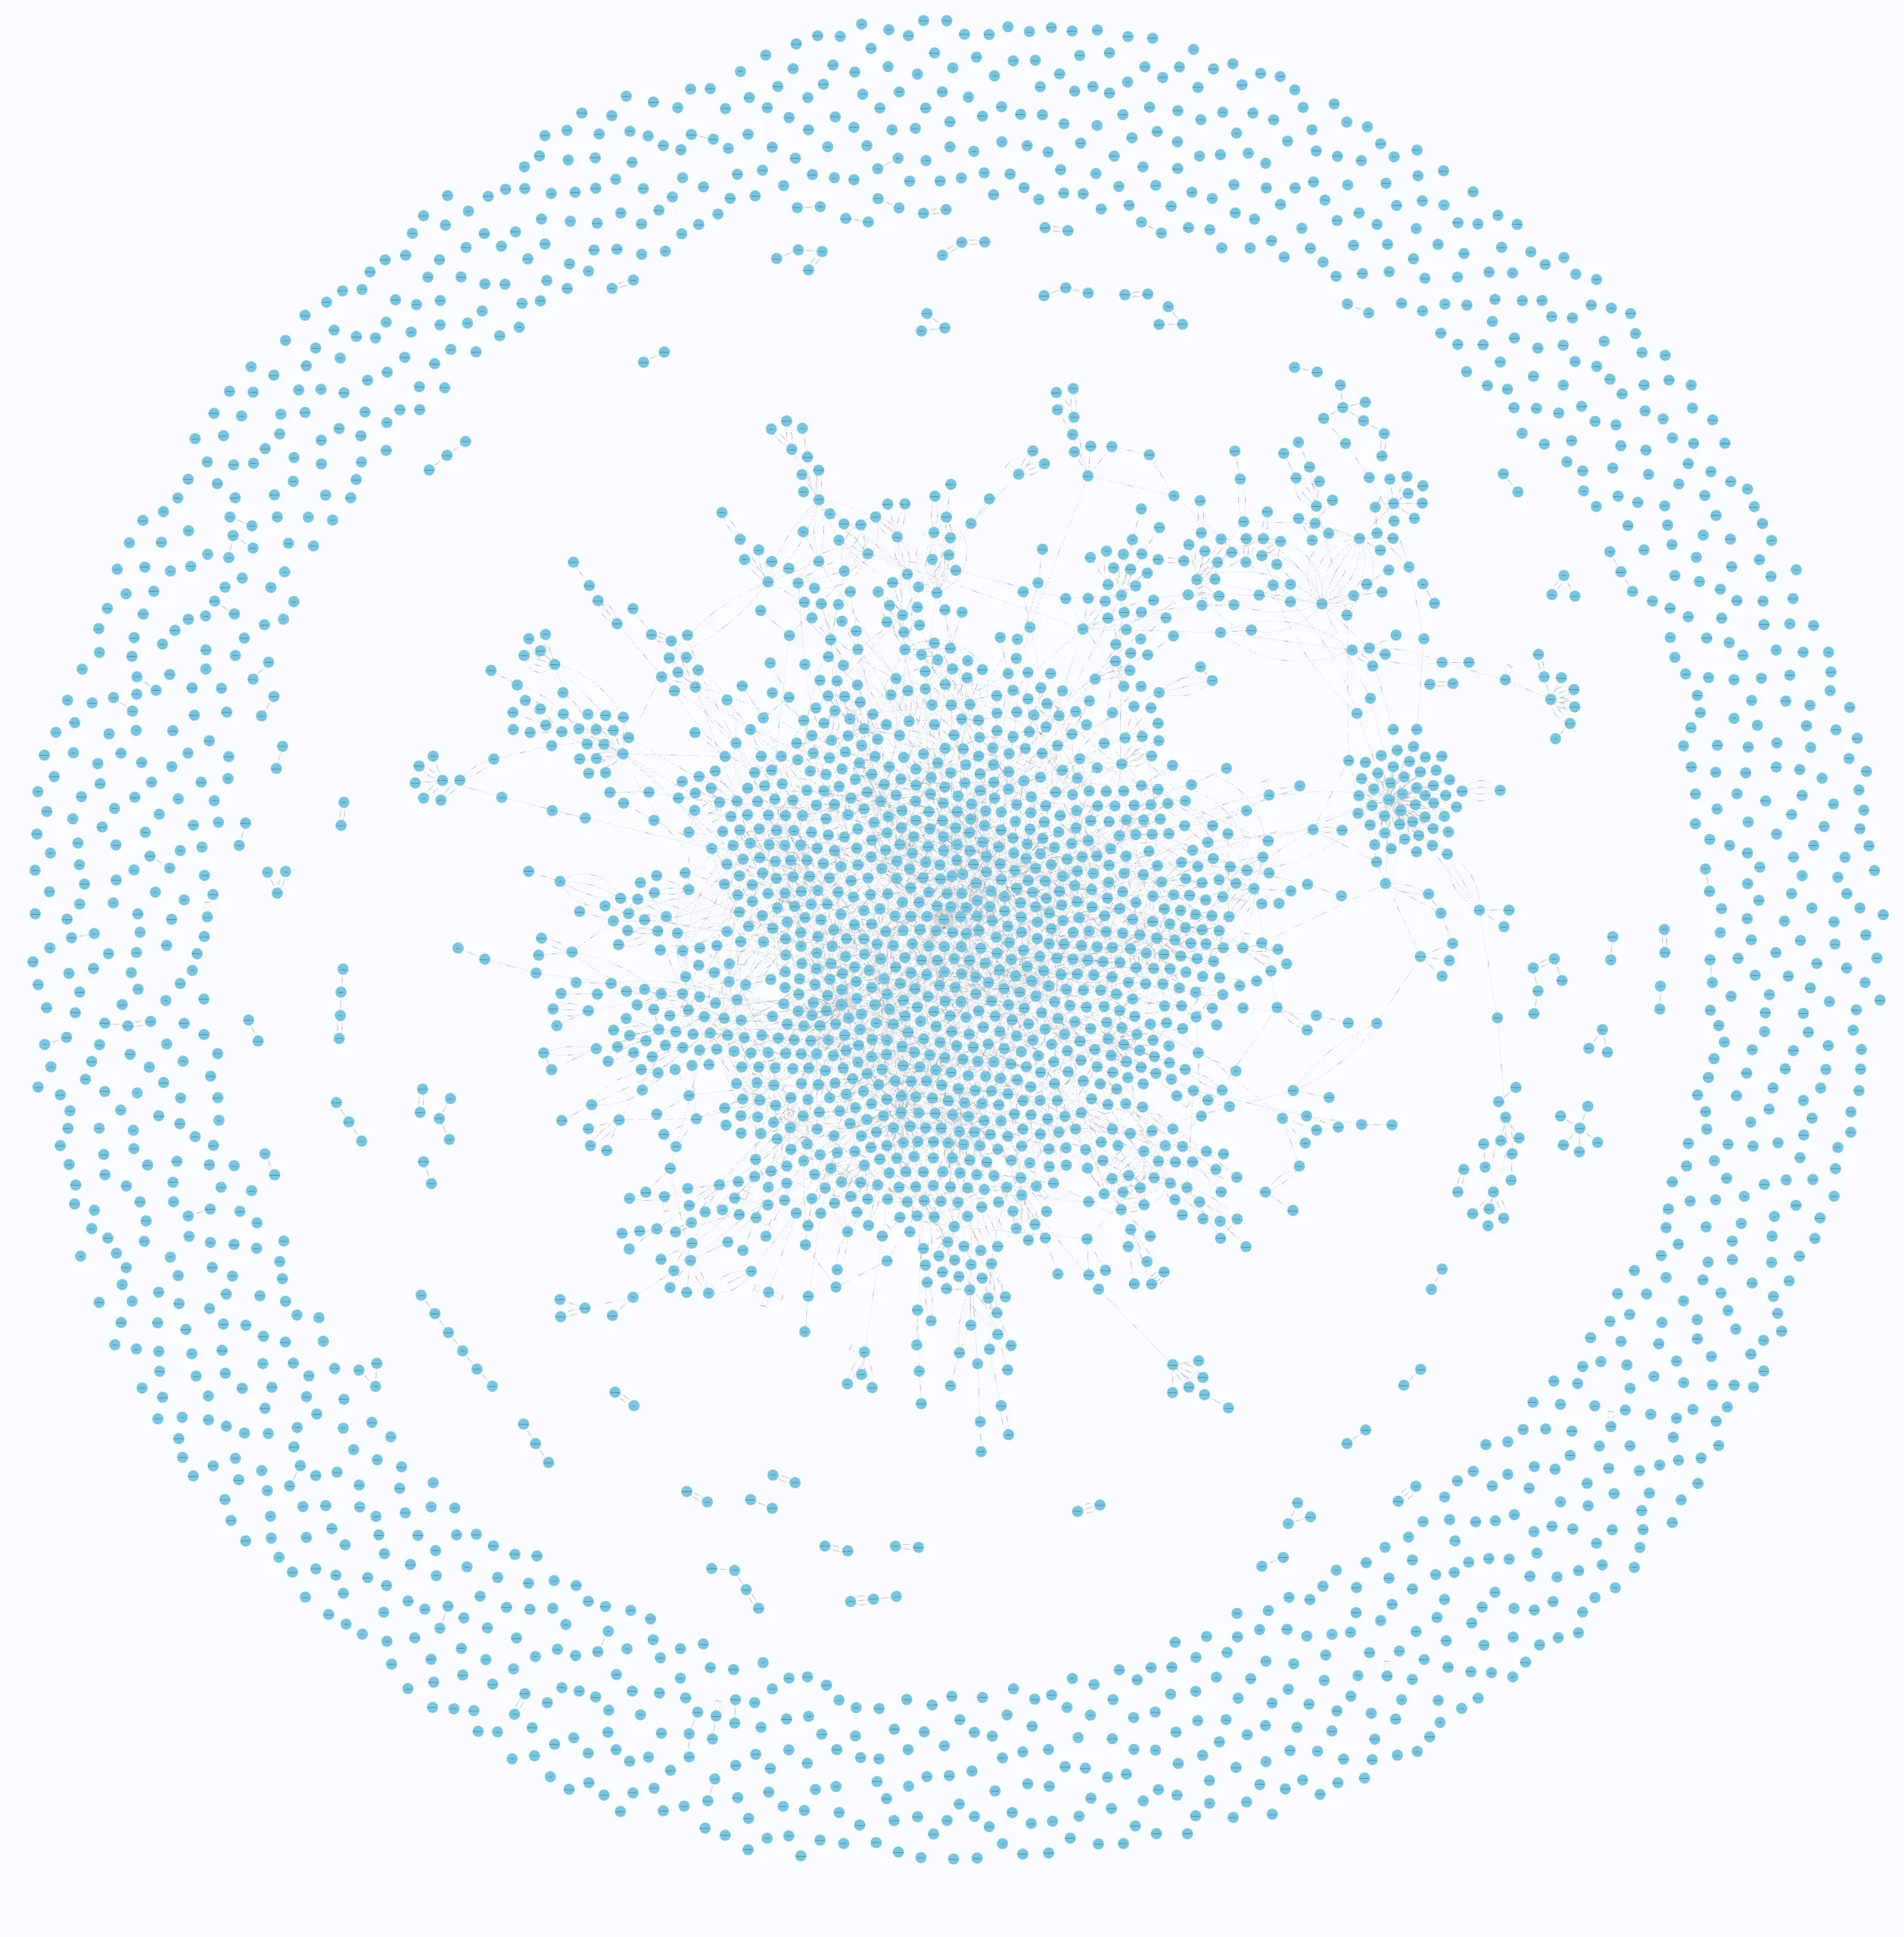
Let’s familiarise ourselves with graph visualisations and queries. In RDBMS we use SQL to describe the data that we want to return in a query. Neo4j uses Cypher, which looks a bit like SQL but describes graph relationships. Here’s a query to show the user nodes:
MATCH (n:User)
RETURN n
Neo4j includes a visualisation tool, which shows the returned nodes:
We can add predicates, such as matching on a particular node property (username, in this example):
MATCH (n:User {username: 'rmoff'})
RETURN n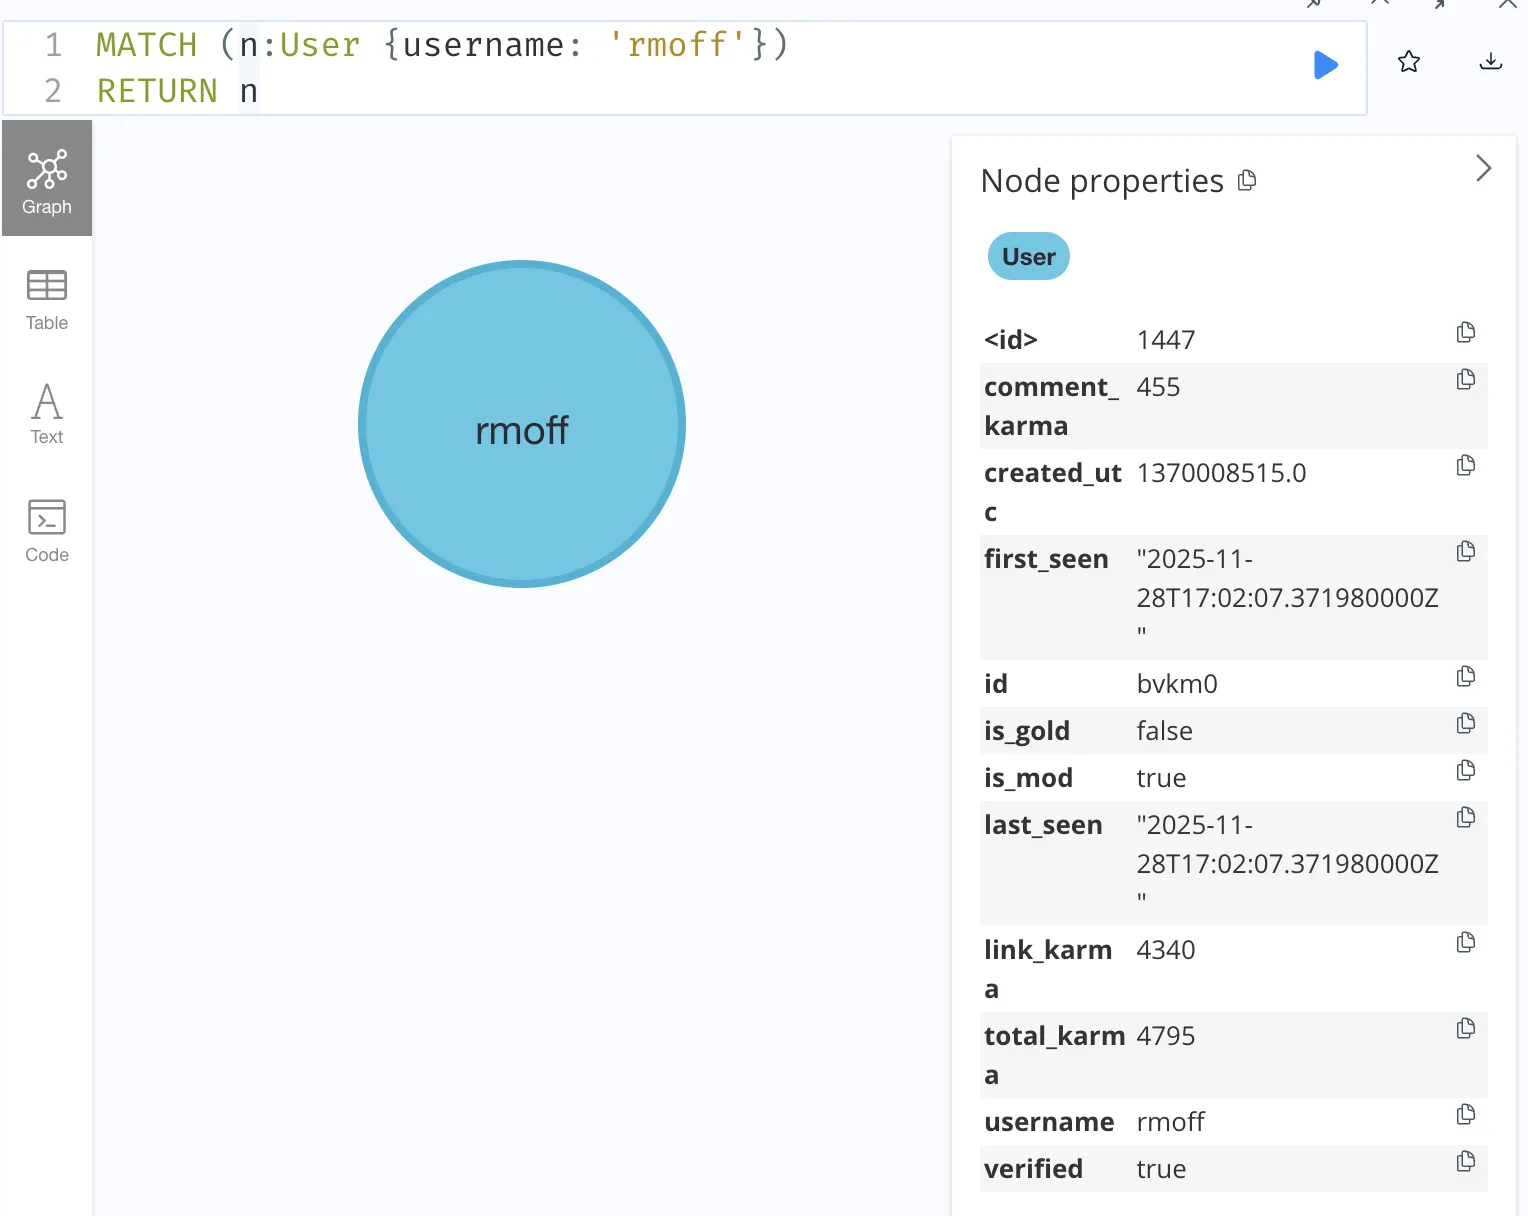
You can also look at the raw data:
{
"identity": 1447,
"labels": [
"User"
],
"properties": {
"is_gold": false,
"is_mod": true,
"first_seen": "2025-11-28T17:02:07.371980000Z",
"last_seen": "2025-11-28T17:02:07.371980000Z",
"verified": true,
"total_karma": 4795,
"comment_karma": 455,
"id": "bvkm0",
"created_utc": 1370008515.0,
"link_karma": 4340,
"username": "rmoff"
},
"elementId": "1447"
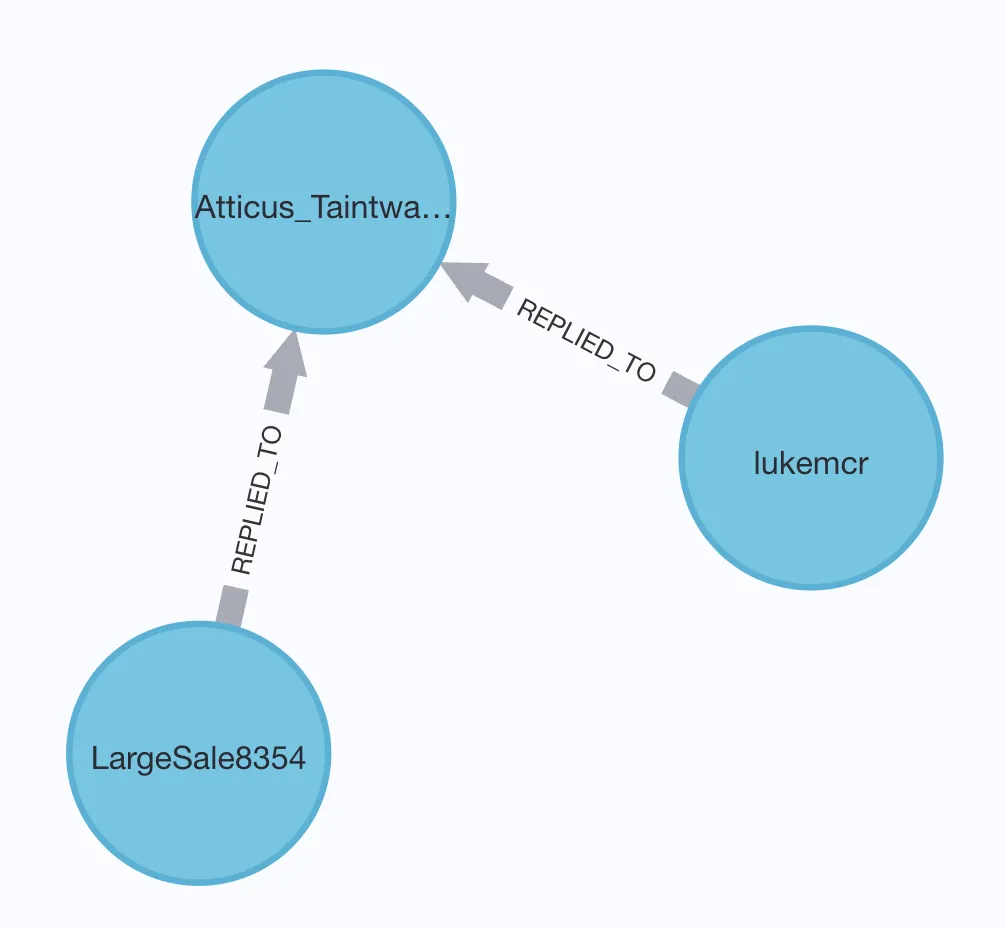
}If we zoom in a bit to the previous query results we’ll see that it’s also showing the edges that have been defined indicating a relationship (REPLIED_TO) between some of the nodes:
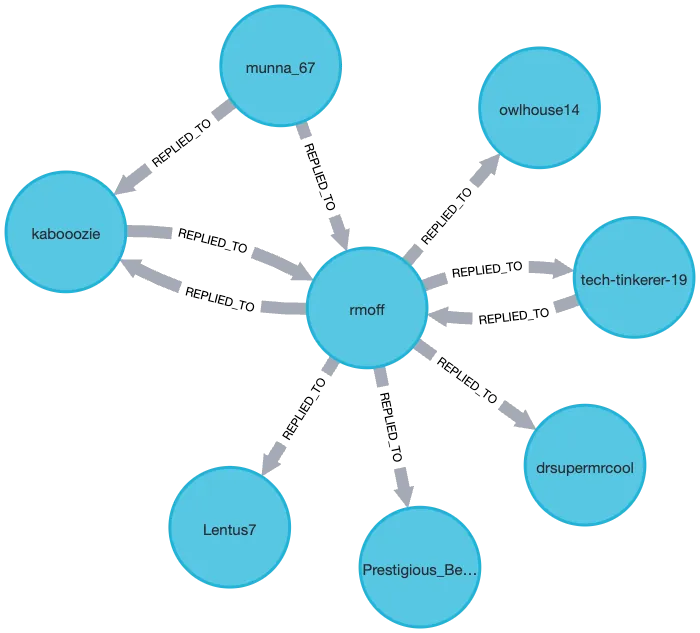
Let’s build on the above predicate query to find my username (rmoff) and any users that I’ve interacted with:
MATCH (target:User {username: 'rmoff'}) (1)
MATCH (n:User)
WHERE n = target                        (2)
   OR (n)<-[:REPLIED_TO]-(target)       (3)
   OR (n)-[:REPLIED_TO]->(target)       (3)
RETURN n| 1 | Predicate in the MATCH clause, using curly-braces |
| 2 | Predicates in the WHERE clause |
| 3 | Match nodes based on either direction of the REPLIED_TO relationship |
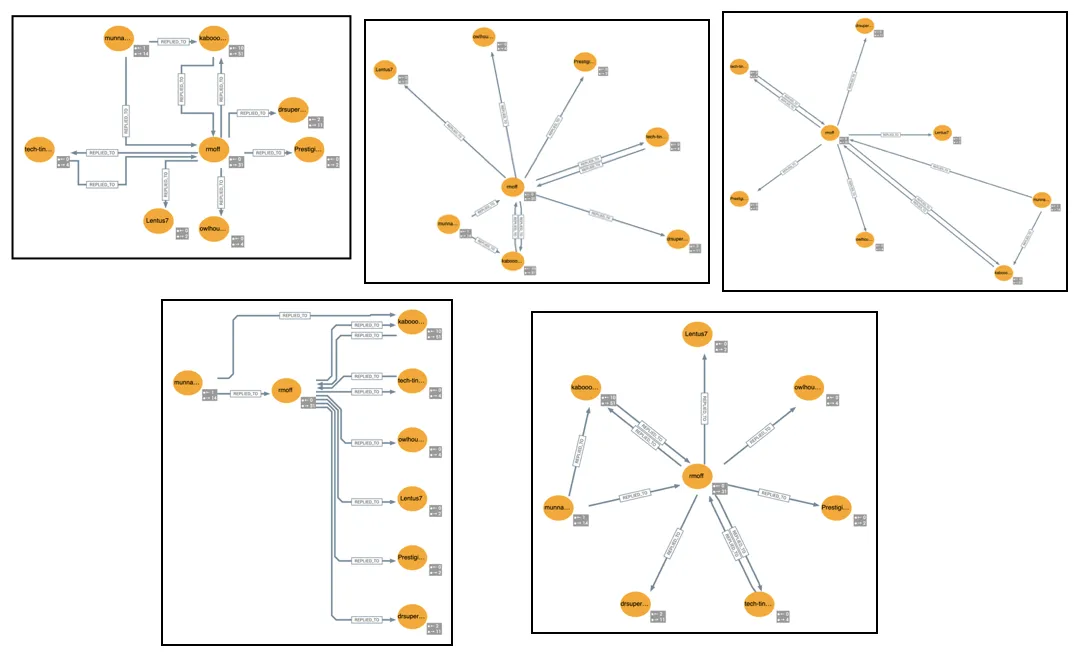
I’m going to head over to a different tool for visualising the data since the built-in capabilities in the free version of Neo4j are too limited for where we’re going with it. Data Explorer for Neo4j is a really nice tool from yWorks. It connects directly to Neo4j and can either use Cypher queries to pull in data, or directly search nodes.
The first reason I like using it is the flexibility it gives for laying out the data. Here is the same set of data as above, but shown in different ways:
Astroturfing 🔗
One of the cool things that graph analysis does for us is visualise patterns that are not obvious through regular relational analysis. One of these is a form of astroturfing.
Since the LLMs (GPT, Claude, etc) are trained on data that includes Reddit, it’s not uncommon now to see companies trying to play the game (just like they did with keyword-stuffing with white text on white background for Google in the old days) and 'seed' Reddit with positive content about their product.
-
For example, genuine user A asks "what’s the best tool for embedding this nail into a piece of wood".
-
Genuine user B suggests "well, a hammer, DUUUHHH" (this is Reddit, after all).
-
The Astroturfer comes along and says "What a great question! I’ve been really happy with ACME Corp’s Screwdriver! If you hold it by the blade you’ll find the handle makes a perfect tool for hitting nails."
Astroturfing also includes "asked and answered" (although not usually from the same account; that would be too obvious):
-
Astroturfer A: "Hey guys! I’m building a house and looking for recommendations for the best value toolkit out there. Thanks!"
-
Astroturfer B: "Gosh, well I really love my ACME Corp’s Toolbelt 2000, it is really good, and I’ve been very happy with it. Such good value too!"
One of the cornerstones of Reddit is the account handle—whilst you can choose to identify yourself (as I do - rmoff), you can also stay anonymous and be known to the world as something like Future_Tangerine_42.
This means that what one might do on LinkedIn (click on the person’s name, figure out their company affiliation) often isn’t an option.
This is where graph analysis comes in, because it’s great at both identifying and visualising patterns in behaviour that are not so easy to spot otherwise.
Poking around one of the subreddits using betweenness analysis I spotted this set of three users highlighted:
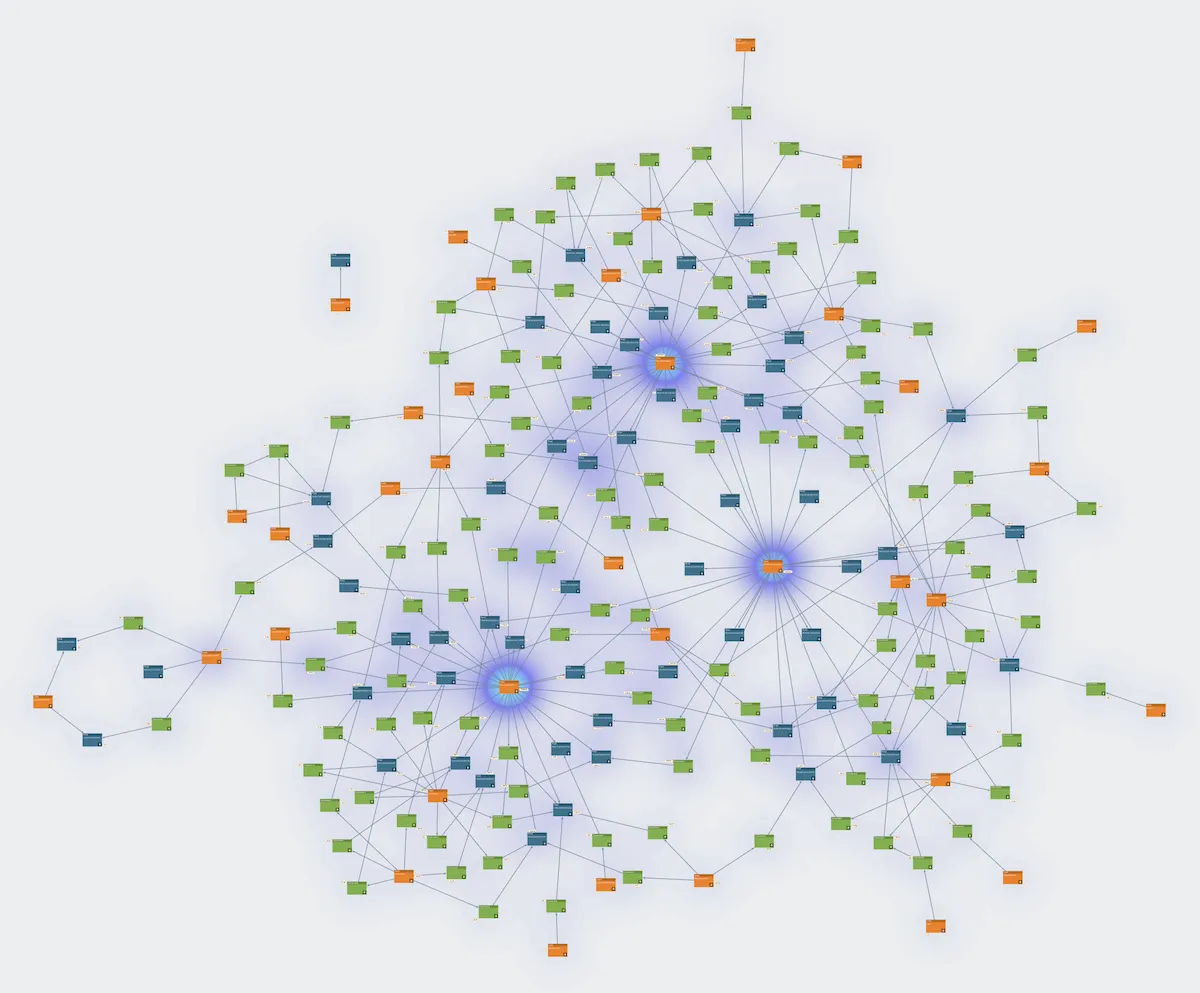
The accounts picked up here are key to the particular activity on the sub; but that in itself isn’t suprising. You often get key members of a community who post the bulk of the content.
But, digging into these particular accounts I saw this significant pattern. The three users are shown as orange boxes; posts are blue and comments are green:
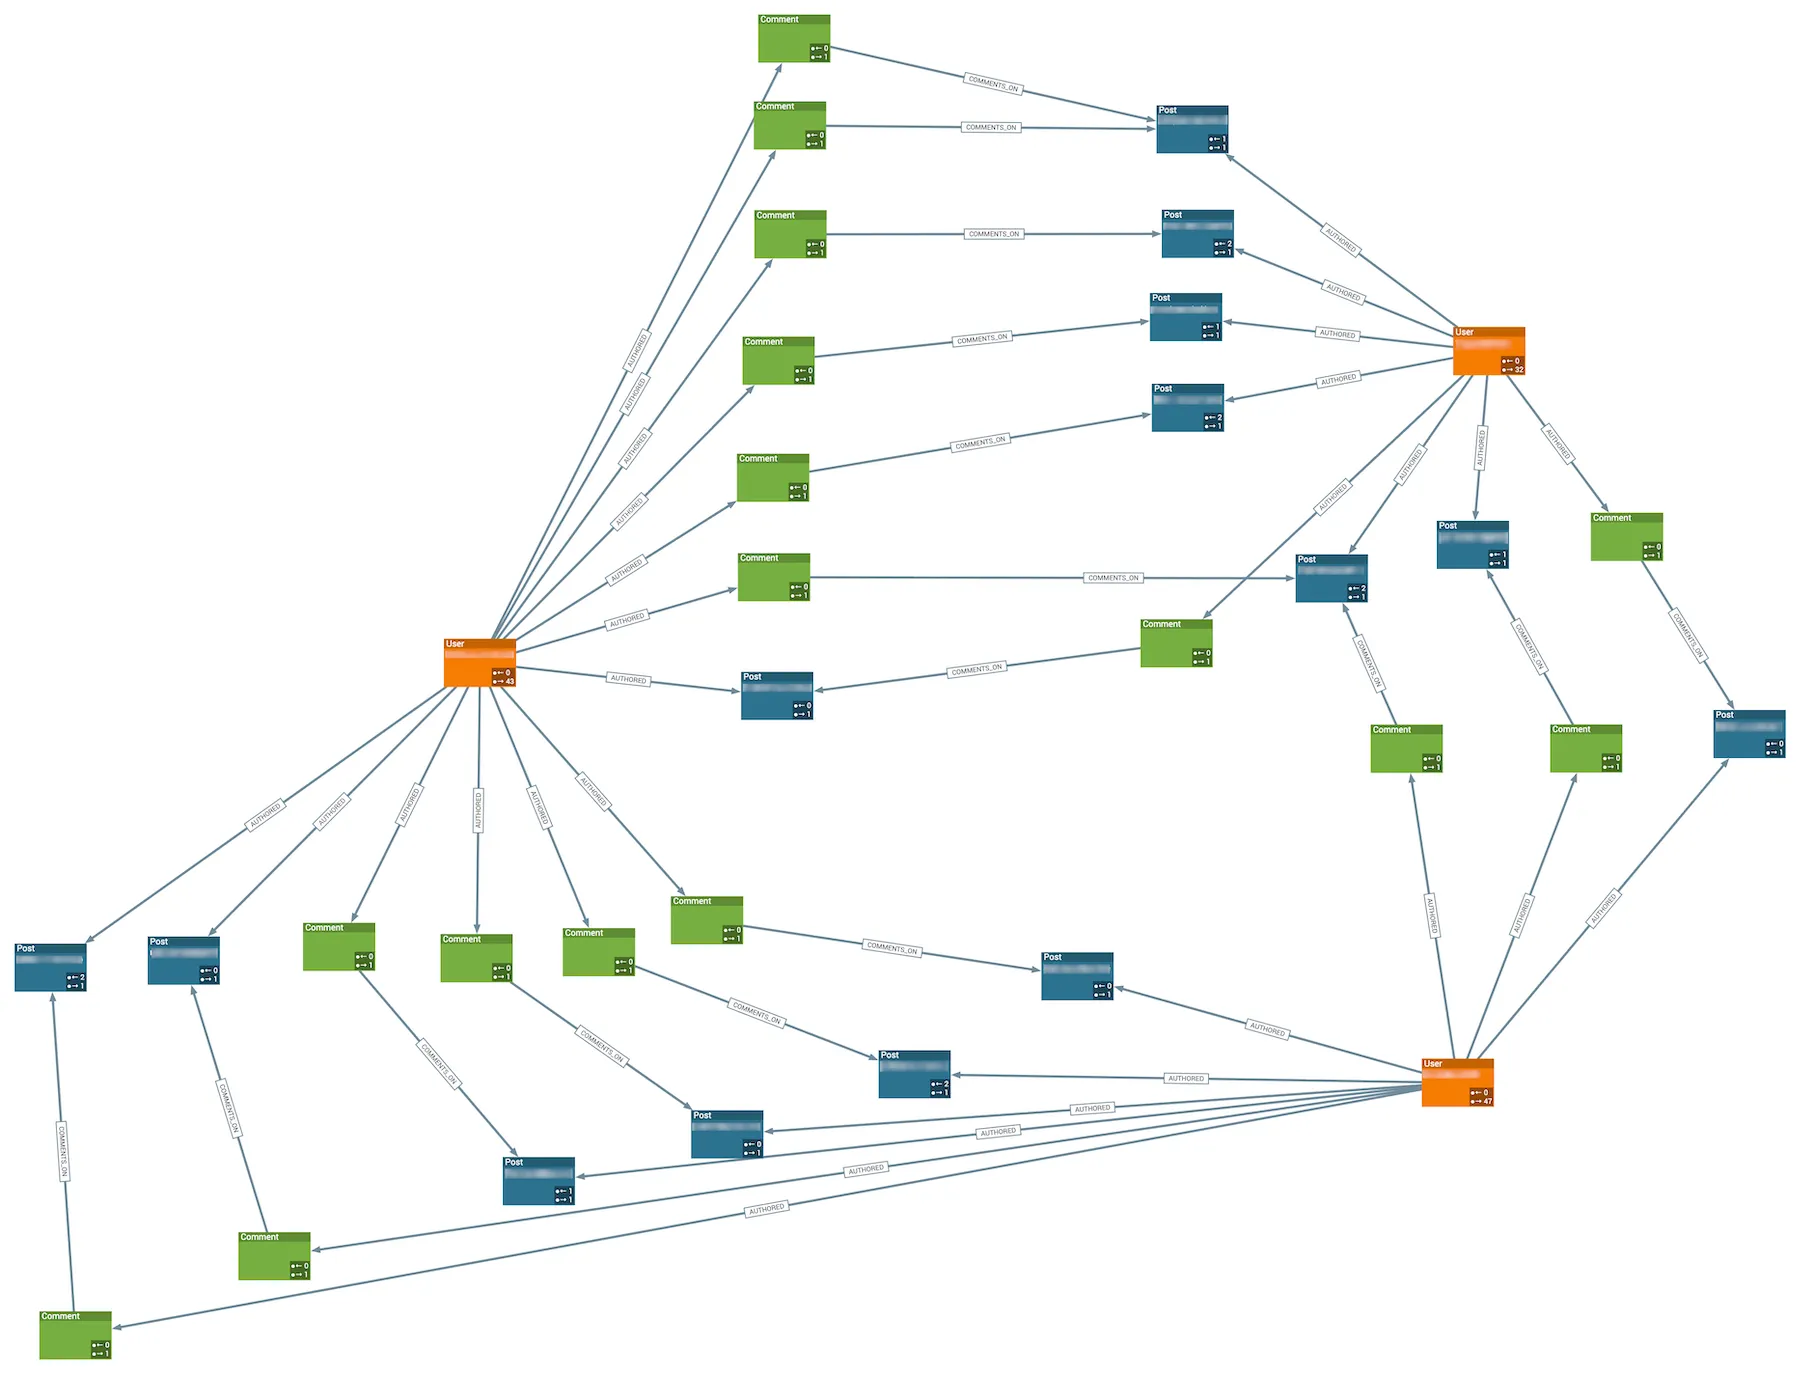
It’s a nice little network of one user posting with another commenting—how helpful! To share the work they each take turns writing new posts and replying to others. Each post generally has one and only one comment, usually from one of the others in the group.
You can compare this to a sub in which there is much more organic interaction.
r/apacheflink is a good example of this:
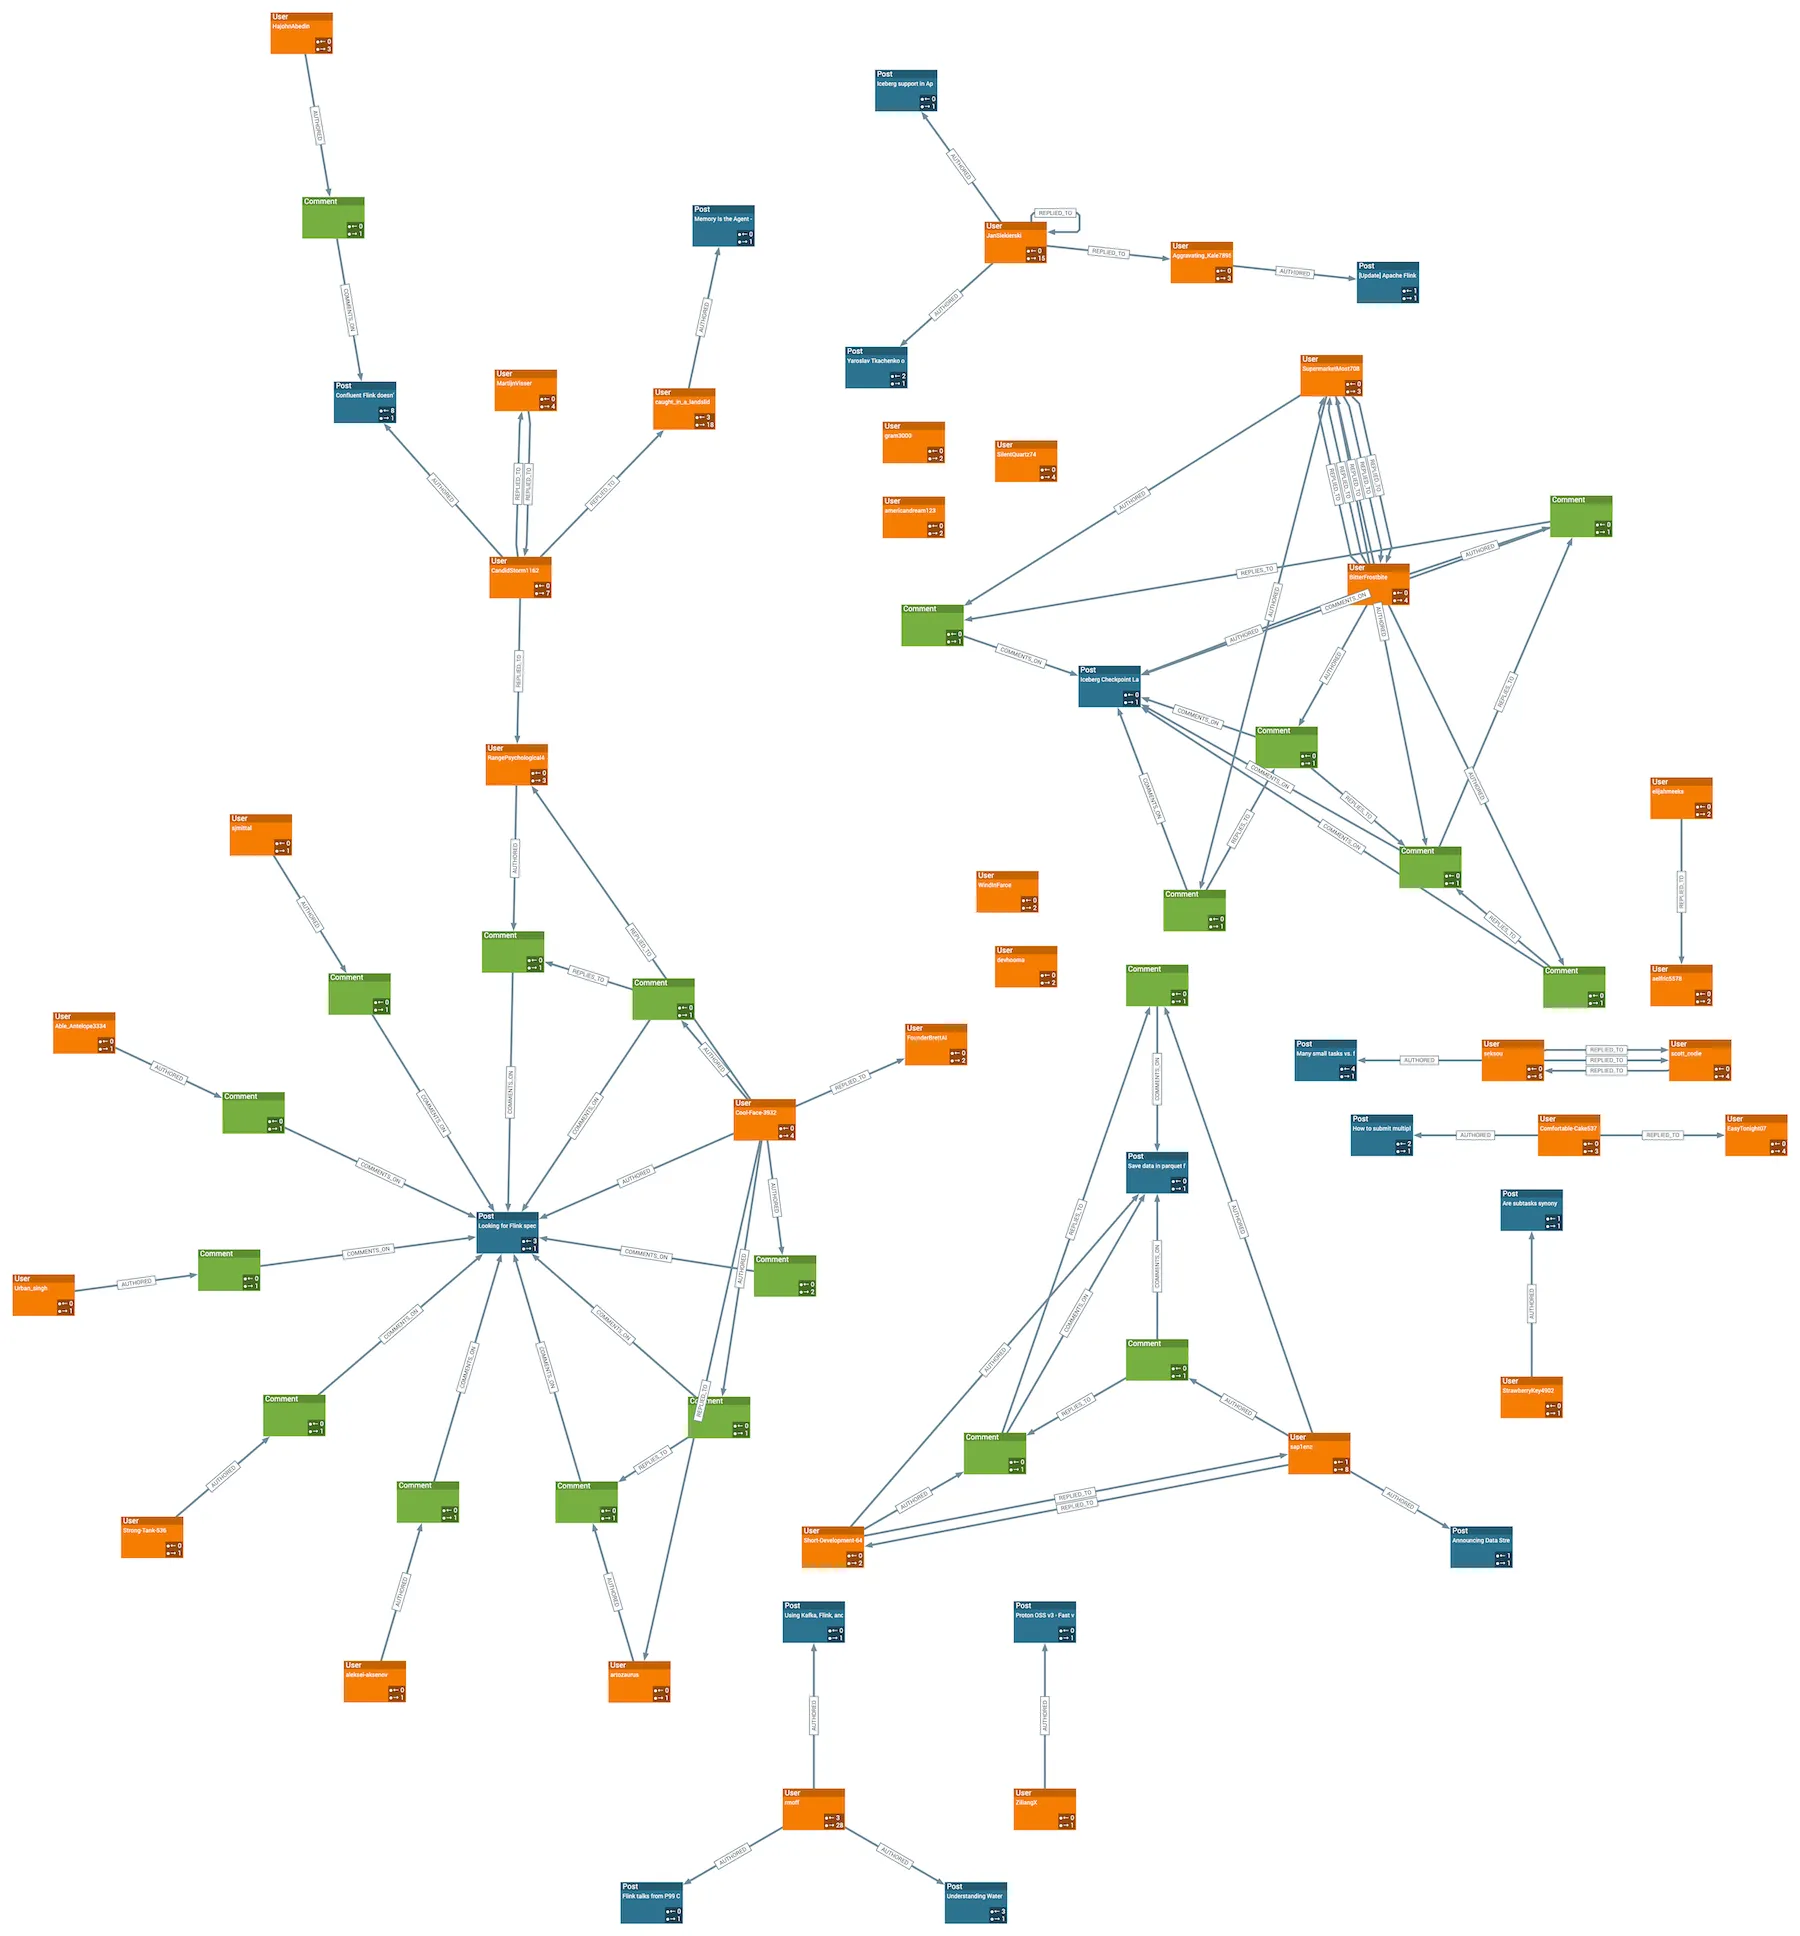
Most users tend to just post replies, some only contribute new posts, and so on. Definitely not the nicely-balanced to-and-fro on the unnamed sub above ;)