
I wrote recently about Kibana’s excellent Timelion feature, which brings time-series visualisations to Kibana. In the comments Ben Huang asked:
do you know how to show whats the difference between this Friday and last Friday by Timelion?
So I thought I’d answer properly here.
Timelion includes mathematical functions including add and subtract, as well as the ability to show data offset by an amount of time. So to answer Ben’s query, we combine the two.
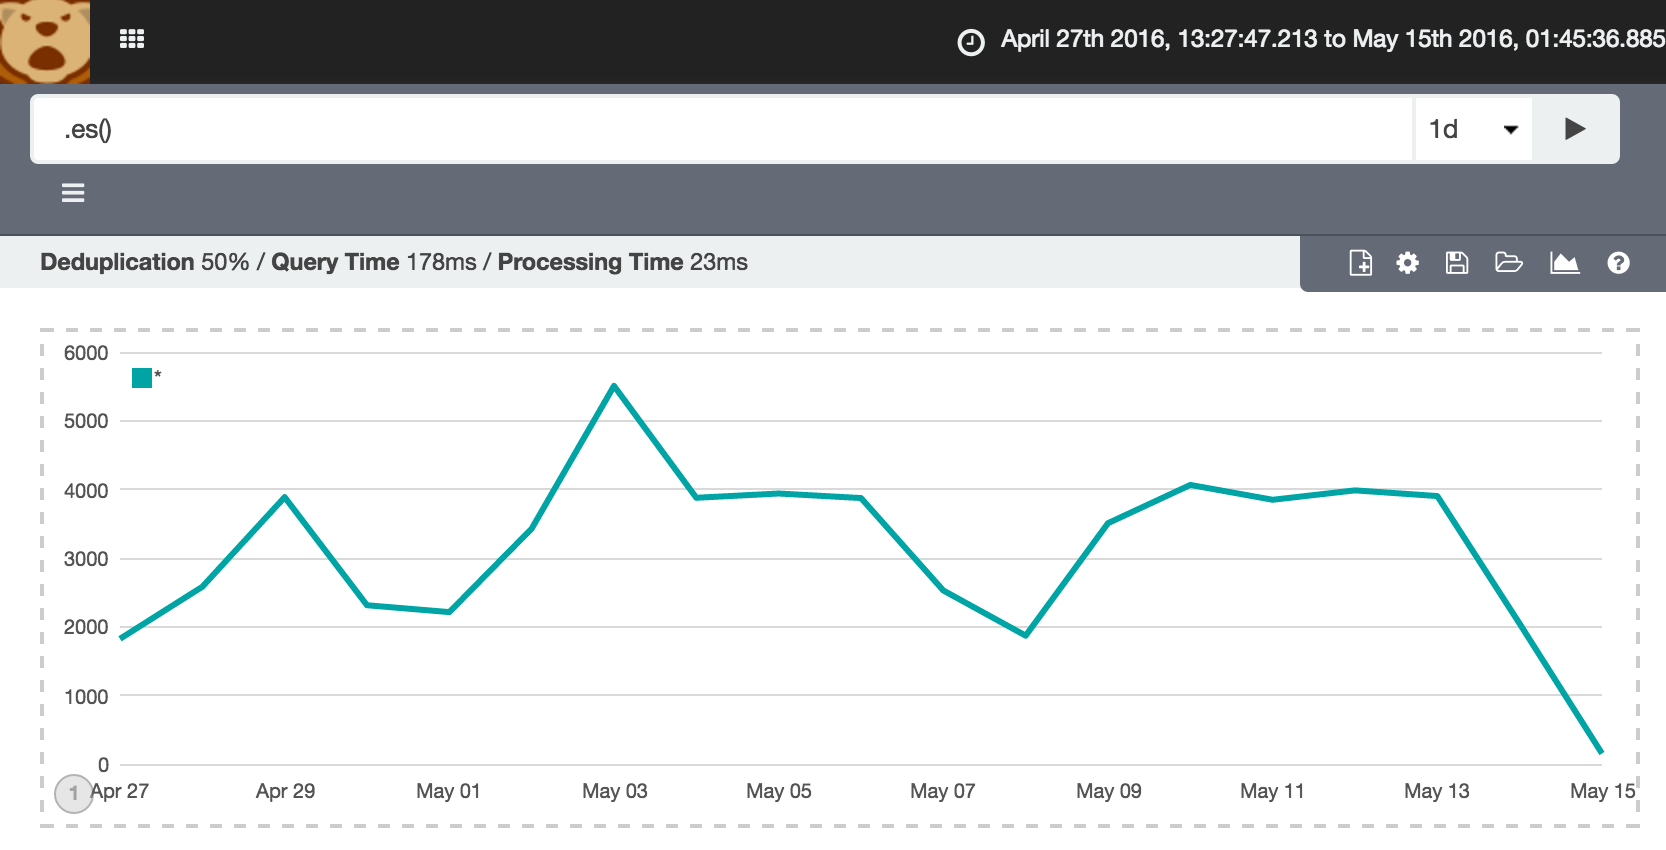
First, our starter series, simply showing a count of all documents across all indices:
.es()
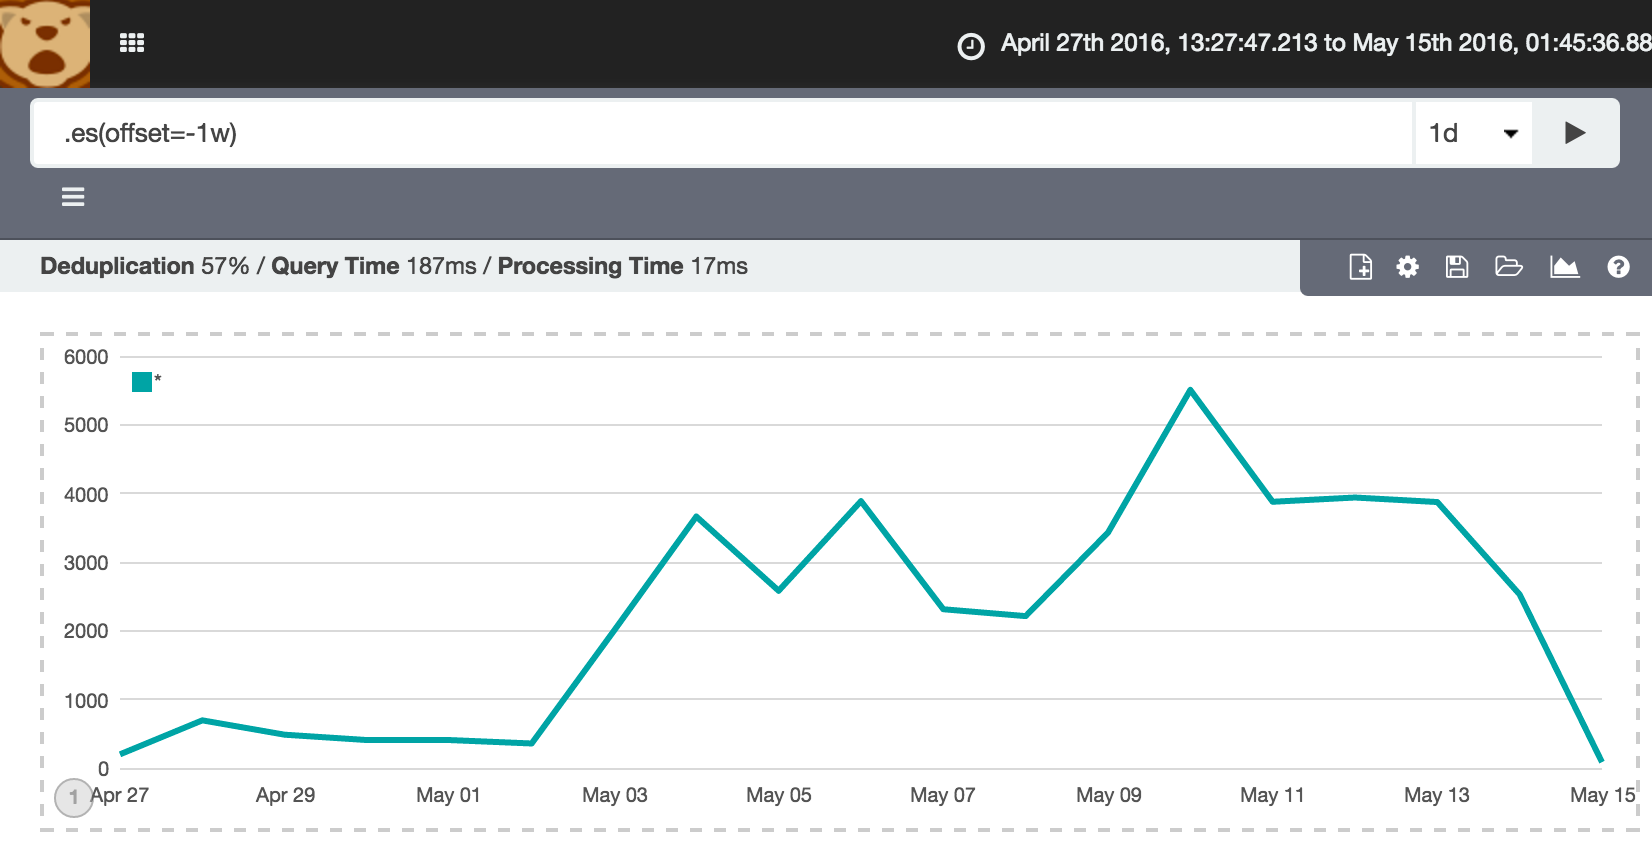
Now let’s check out the offset function, showing the same data but for the previous week:
.es(offset=-1w)
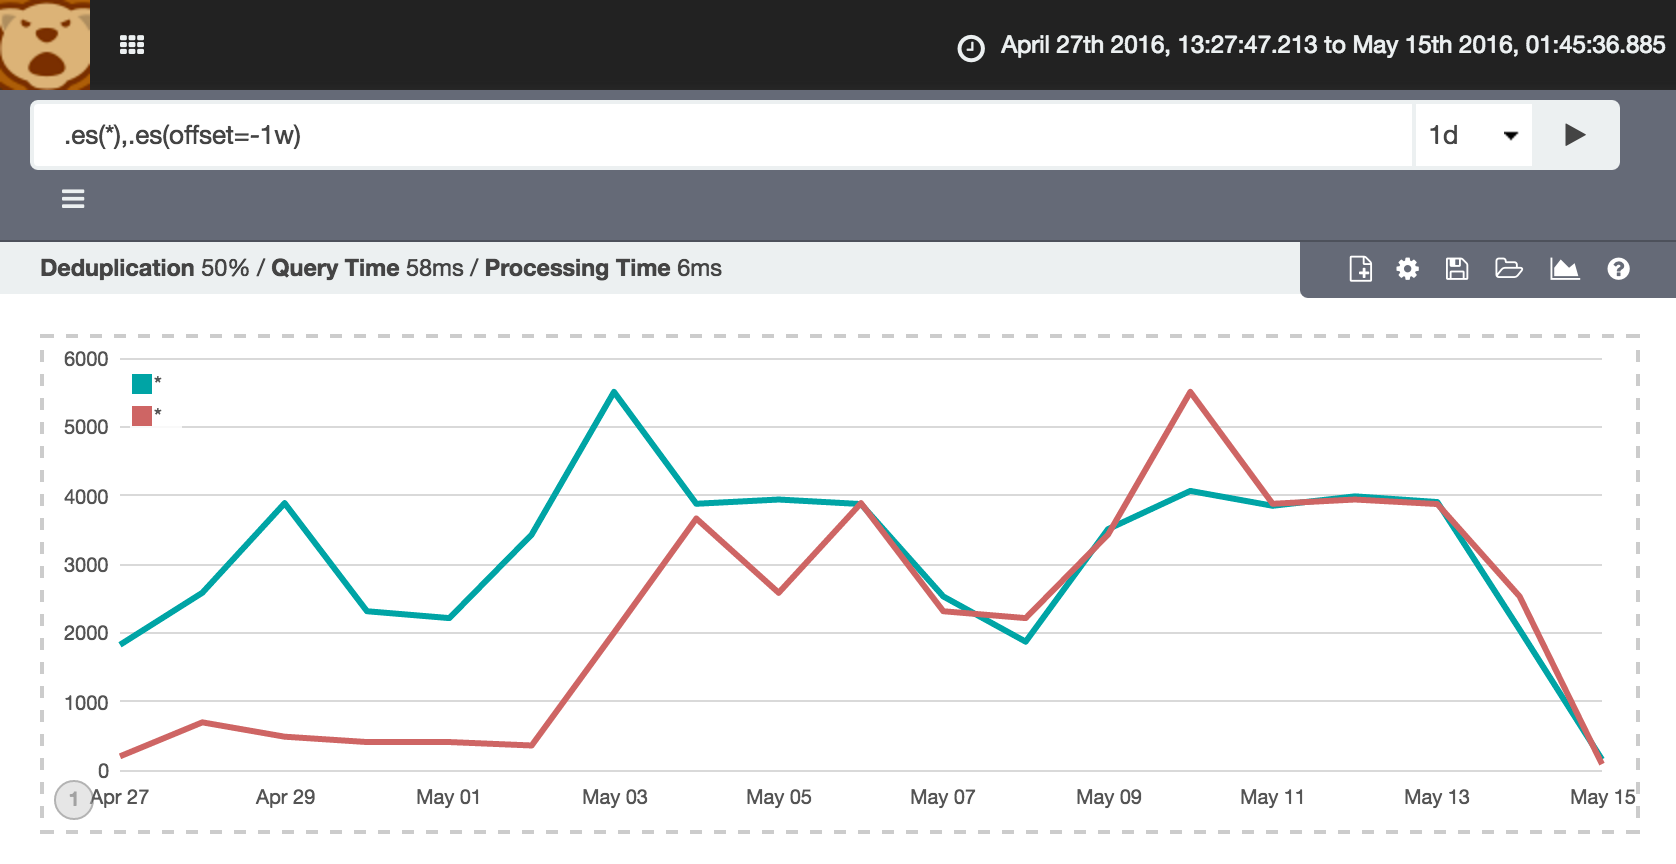
We can combine the two on the same chart:
.es(*),.es(offset=-1w)
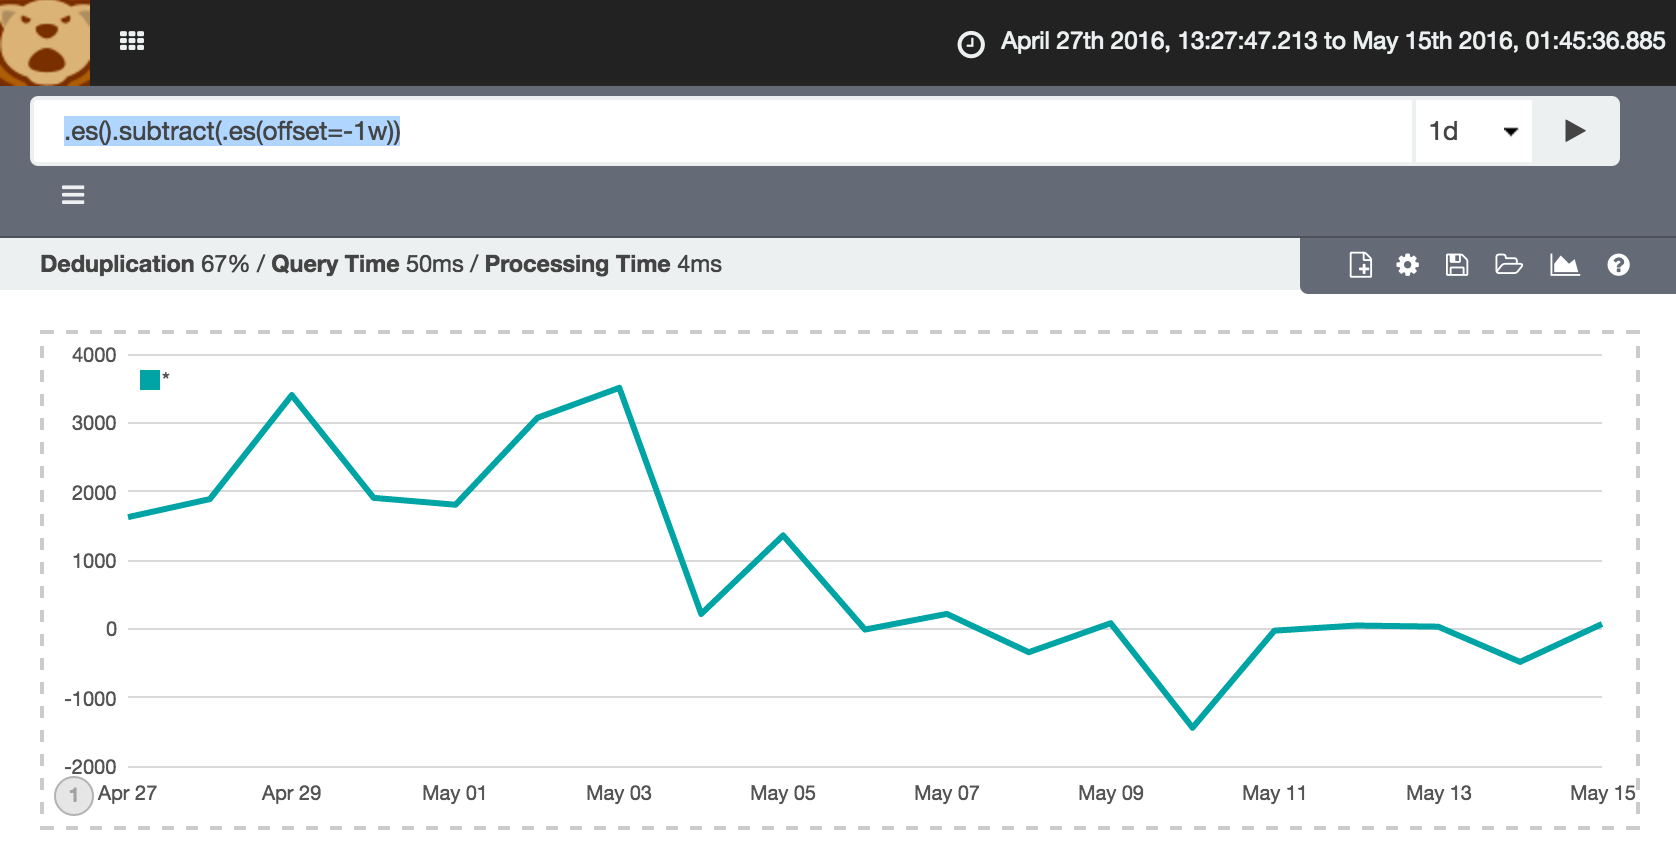
And then we can subtract one from the other:
.es().subtract(.es(offset=-1w))
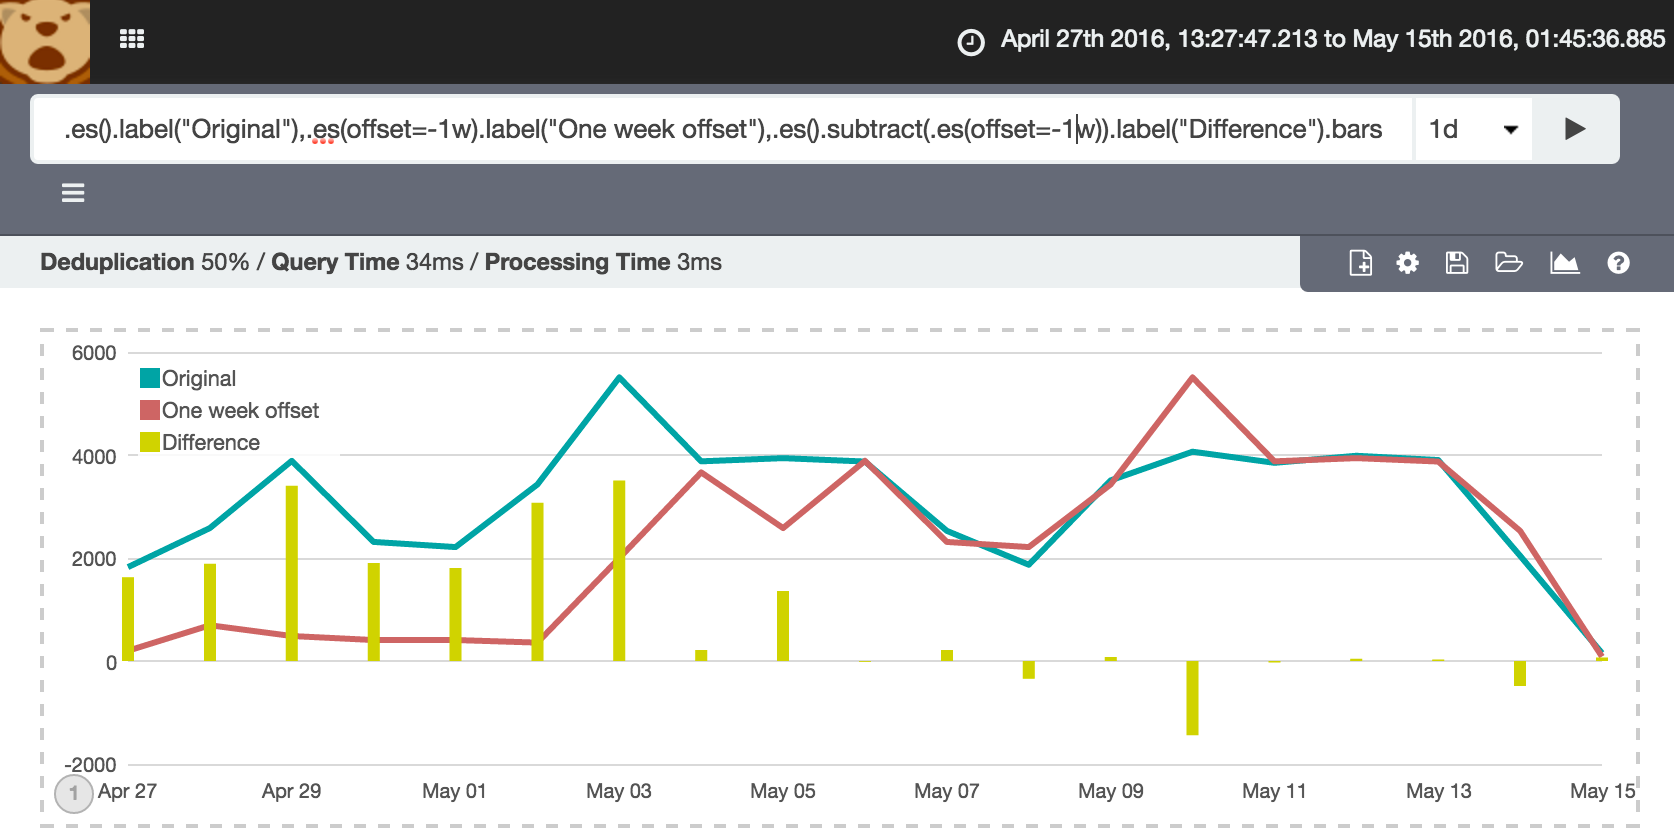
Tarting it up a bit, we can show all three series, adding label for each, and formatting the difference series as bars instead of lines clearly to identify it better:
.es().label("Original"),.es(offset=-1w).label("One week offset"),.es().subtract(.es(offset=-1w)).label("Difference").bars()
Mucking about with the lines syntax, setting a fill and zero-width lines, we can show bars but with width of each data point (1 day):
.es().label("Original"),.es(offset=-1w).label("One week offset"),.es().subtract(.es(offset=-1w)).label("Difference").lines(steps=1,fill=2,width=0)

So there you have it - the difference calculation between two time points in Timelion, with a bit of formatting fun thrown in for a bonus.